Basic Equipment Reliability Examples
- Home >
- articles >
- maintenance-management >
- equipment reliability examples
Learn in these equipment reliability examples why you must use all four system reliability factors.
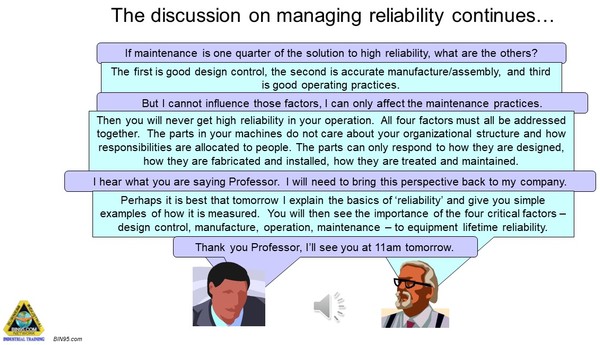
Follow Bill as he learns why using all four of the system reliability factors is a must using simple equipment reliability examples within the excerpt below from the full Reliability and Maintenance Management Course PowerPoint download. The course PowerPoint starts out with Professor Miles, the reliability researcher, teaching Bill the concepts of reliability and showing him how they are applied through maintenance strategy. The excerpt below is from the beginning of day 1 of the 3-day reliability course.
What is Reliability?
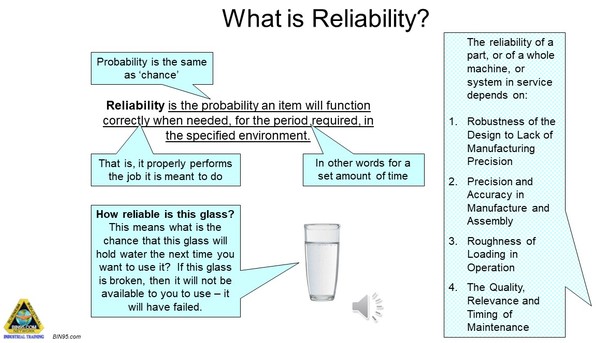
Reliability is the measure of how long a thing will last and still be able to provide the service it was originally brought to do. Once a thing cannot fulfill its original purpose it is said to have ‘failed’. When something is broken it clearly has ‘failed’. But a thing can have ‘failed’ even though it is not yet broken. For example, a pump can still be working and pumping, but if it no longer delivers the pressure and/or flow that it was installed to do, then it has ‘failed’ This is called a ‘functional failure’ because it does not provide the function (pressure and flow) it was installed to do.
Hence, ‘equipment reliability’ measures the likely length of equipment working life between ‘failures’.
High reliability is valued in the industry because it means that parts and components go for longer before they fail. That means more production from plant and equipment for less maintenance cost.
- Reliability is customer satisfaction driven.
- Reliability is measured at end of life – the probability of functioning to design for a period of time.
- Reliability is observable by a number of returns and service call-outs from customers.
In manufactured products the reliability comes from its design, materials, manufacturing and use in-service.
Equipment Reliability Examples:
Equipment reliability examples were applied to analyze the reliability of a glass.
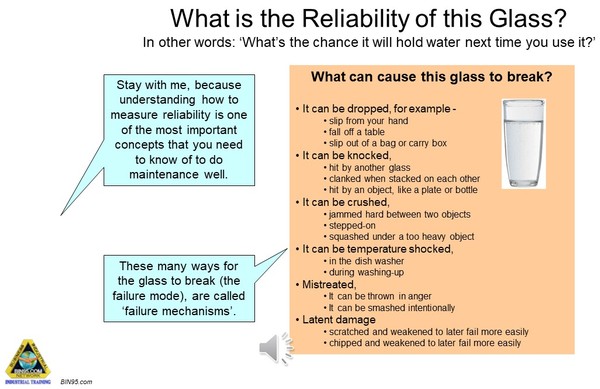
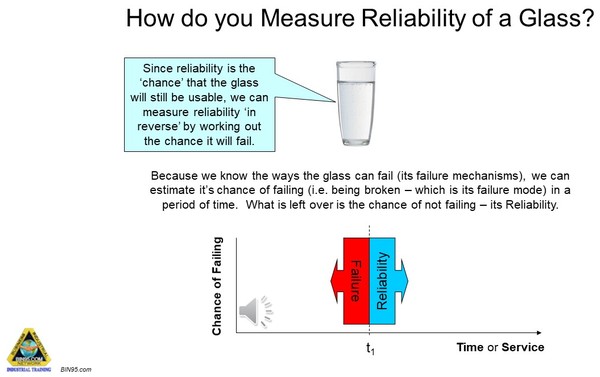
If ‘reliability’ is the chance that a thing will work properly, we can ask what will stop the glass from ‘working properly’. There are numerous reasons that a drinking glass will break (the ‘failure mechanisms’), many of which are listed in the table on the slide. Each cause of failure can happen to a drinking glass if particular circumstances arise. This means the ‘chance’ of the glass breaking depends on the frequency, or how often, that ‘bad’ circumstances arise. But before the glass breaks it needs to be both put in danger (the opportunity) AND enough force applied (the failure mechanism) to break it.
Most often people say ‘failure modes’ rather than ‘mechanisms’.
How to Measure Reliability?
Some glasses survive for centuries, others less than a week. The glass is not such a good example to equate to equipment component reliability because ALL glasses, regardless of design, are close to being equally vulnerable, so the only things helping them to survive is how they are treated and the intensity of use (i.e. Operator precision). Most other things can be designed to be more inherently reliable.
The use of a drinking glass as an example, though not a true reflection of what happens in operating equipment (because glasses are failed by accident, i.e. a Poisson event, and not by being worked under load conditions), will still help us to envisage the concepts of reliability. As we go through the glass example, we need to remember that it is not really the same as a part in a machine, and we cannot directly relate the failure behavior of a drinking glass to the reliability of parts in operating equipment.
Measuring Reliability: Number of Failures.
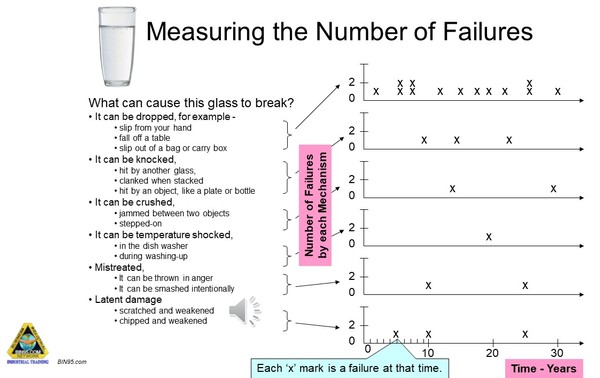
From personal experience, we can plot our own history of glass breakage onto a graph. In the slide, you see the number of glasses broken in a household during a thirty-year period listed by the failure mechanism that caused the breakages. You can see that of the 24 glasses broken over 30 years, dropping is the main reason for breaking glasses.
Make sure you understand that the timescale of use is important. The best glasses that come out only for Xmas and weddings last longer because the time in use, and so at risk, is less. In such situations, there is less chance for things to go wrong because they are not put in circumstances where failure is possible.
Measuring Reliability: Rate of Failure.
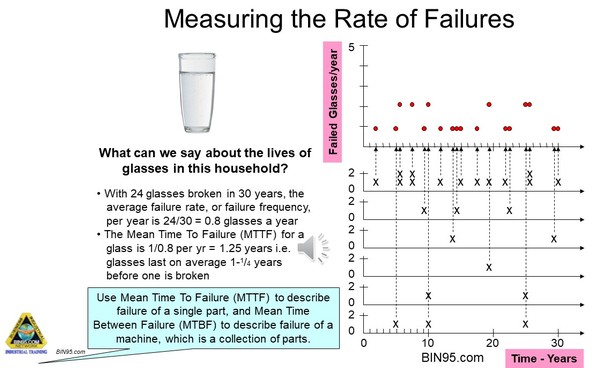
Once we know the number of glasses broken over a period of time we can work out a lot about the chance of glasses being broken in that household.
It would be risky to assume that what happened to glasses in one household is the same for every other household. Whether we could claim what happens in my house to glasses is the same as would happen in every house is too much to assume. To be sure how representative the treatment of glasses in my house was compared to the real world, you would need to do a do random sampling of many other households.
We also need to consider that the stock of glasses can be managed in two ways - 1) do not replace any until the last one is broken and then get a new set, or 2) replace a glass each time it is broken so we always have 24 glasses. One must distinguish between the estimate of the rate of failure from a sample of 24 that are run to failure, and the rate of failure in a stock maintained at 24 by replacing those broken – they are not the same.
Converting rate of failure to chance of failure:
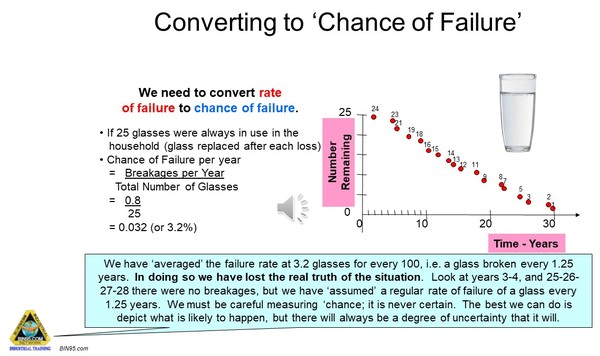
To calculate the probability, or likelihood, of a glass failing we need to know the total number of glasses in use.
Probability of Failure = Number Failing in Time Period
Total Number at Risk
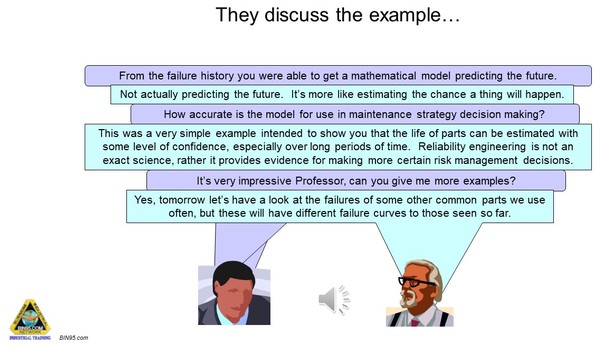
Because we are dealing with ‘chance’ we can never be sure when a failure event will happen. We have developed an ‘average’ measure for when failures of a drinking glass occur, but it is not the same as predicting the real failure. A little later in the course, we will use the ‘averaged’ rate of failure to predict how much time is left before a part fails. But it will only ever be an estimate because our ‘average’ is not what will actually happen. We should not be surprised to find that our predictions are wrong when ‘chance’ is beyond our control. (Or is it?)
At this point, you need to be aware that there is an important difference between glasses breaking and parts failing. For the sake of simplifying the explanation, our glass example has taken accidental breakages and modeled them as if the glass was in constant use, like a part in a machine. This is not strictly correct since the glass can only be broken by accident (i.e. a Poisson event), but a part is broken by failure mechanisms present in its use (i.e. a random event), as well as human error, which is a Poisson event.
The Failure Curve:
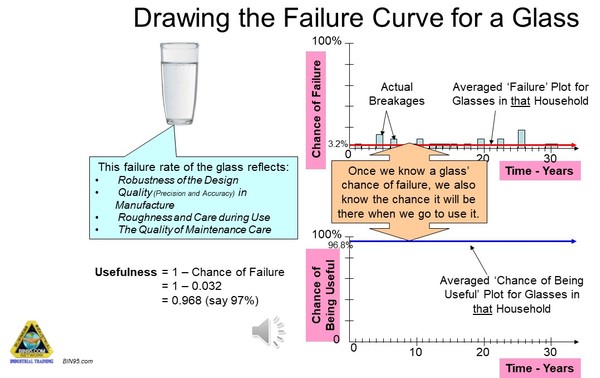
Once we know the chance of failure for a drinking glass, we also know the chance the glass will be present and available for use.
Drinking glasses are unusual in that they do not wear out. Most plant and equipment parts degrade with use. Because glasses do not break by themselves, they break from accidents, we can say that they only fail from human errors and ‘acts of God’ (like an earthquake). They are broken only when the circumstances and a failure mechanism align by chance. So, we say that the breakage of glasses is a chance event, but not a ‘random event’. A random event is one that happens from the continuous presence of numerous failure mechanisms that may (or may not) produce a failure.
Random Failures:
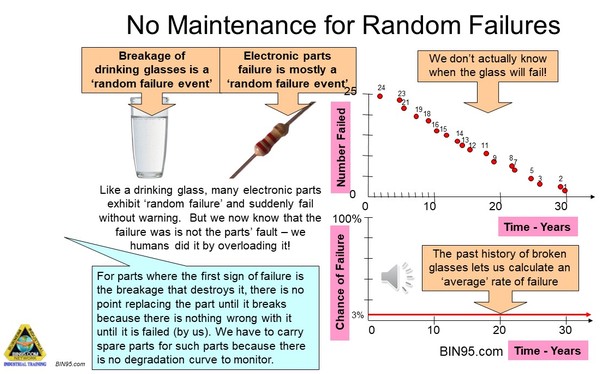
In ‘random failure’ situations there is no certainty when a failure will happen. You can go for years without anything going wrong, or you can get several failures in close proximity.
Random Failures are Preventable:
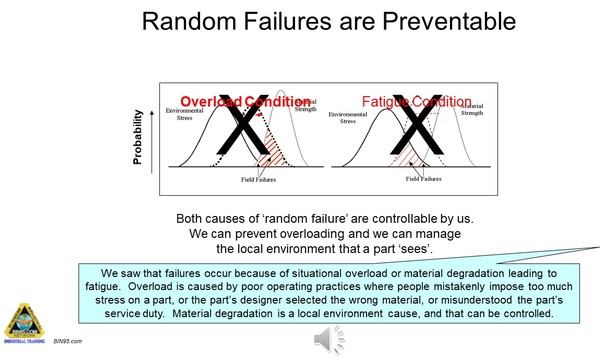
In the Left-Hand graph, overload is not a separate distribution but a tail of the stress distribution. Therefore, overload failures are less prevalent than fatigue. It is possible that different equipment operators have different stress distributions in different environments. This is why you never buy a car used previously for hire (e.g. Avis, etc.) – you don’t know how much overloading was done by previous users.
Predictive Reliability:
To download more equipment reliability examples, using actual machine parts, see the 235 slide Reliability and Maintenance Management Course PowerPoint today. Also to see more future examples from our courses, follow us on social media. (Icons on the left or bottom of this page.)