- Home >
- articles >
- maintenance-management >
- overall equipment effectiveness oee
OEE: Overall Equipment Effectiveness
Oh, "Equipment Effectiveness". I've heard about that before!
Unfortunately, that's all OEE (Overall Equipment Effectiveness) is to the personnel in many facilities. Something they heard of, talked about, or read about. Many maintenance management departments today still need to effectively utilize the OEE tool even though it's widely used among world-class companies.
Definition of OEE: Overall Equipment Effectiveness
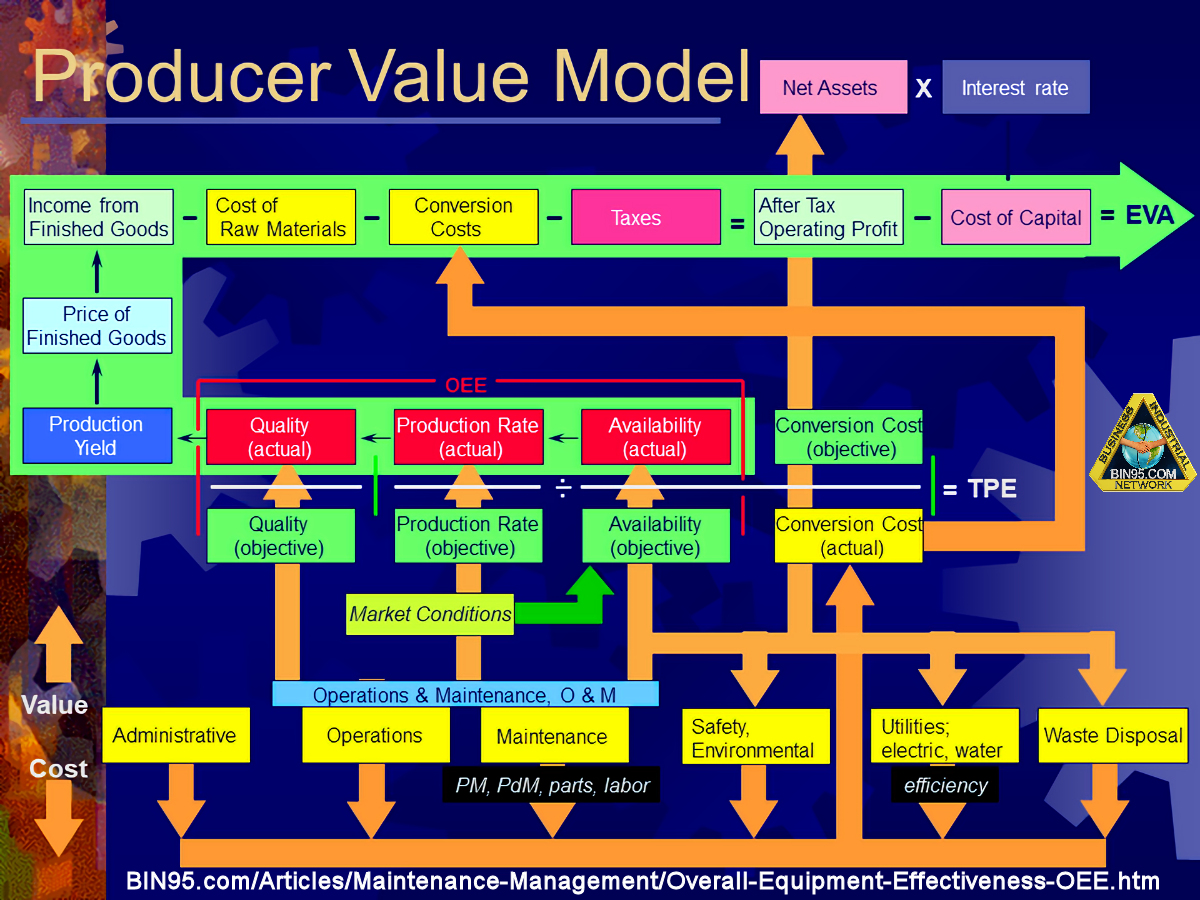
The overall performance of a single piece of equipment or even an entire factory will always be governed by the cumulative impact of the three OEE factors: Availability, Performance Rate, and Quality Rate.
OEE is a percentage derived by multiplying the three ratios for the abovementioned factors. The OEE percentage is used for analysis and benchmarking. |
In speaking with Mike Sondalini (Best Practice Facilitator/Author) about a similar topic, Root Cause Analysis (RCA), Mike made a statement that identifies one of the main barriers to successful OEE implementation today.
Mike: "I must admit that a lot of people know of RCA and its implications, but very few people use it. I think it's because they can't convince enough of the right people at their workplace to try it and then stick with it."
I have experience that OEE has had better coverage than other analysis tools like RCA or Fault Tree Analysis (FTA). Maybe because Overall Equipment Effectiveness is also a benchmarking and analysis tool. Below, I will go over what OEE is, why you should use it, and how to use it.
What is OEE?
OEE = Availability X Performance Rate X Quality Rate
Availability - Percent of scheduled production (to measure reliability) or calendar hours 24/7/365 (to measure equipment utilization) or equipment or line status (to measure the ability to produce) that equipment or a production line is available for production.
Note: Measures the percent of the time the equipment is operational (usually total hours of 24-7-365), divided by the equipment uptime (actual production).
Performance Rate - Percent of parts produced per time frame, of maximum rate OEM rated production speed. If OEM specification is unavailable, use the best-known production rate, or the company can establish a standard production rate.
Note: Performance efficiency is the percentage of time the equipment produces products at its theoretical speed for individual products. It measures speed losses. (i.e., inefficient batching, machine jams)
Quality Rate - Quality as a percent of good sellable parts out of total parts produced per time frame.
Note: Determining the percent of the total output that is good. (i.e., all products, including production, engineering, rework, and scrap.)
Example: 50% Availability (0.5) X 70% Performance Rate (0.7) X 80% (20% Quality Reject Rate results in 0.8 acceptable) = 30% OEE
(Please explore more with this free online OEE calculator.)
OEE Calculator
Example: 50% Availability (0.5) X 70% Performance Rate (0.7) X 20% Quality 80%(0.8) acceptable = 30% OEE
Why use OEE?
Overall Equipment Effectiveness (OEE) saves companies from making inappropriate purchases. It helps them focus on improving the performance of machinery and plant equipment they already own. OEE is used to find the most significant areas of improvement, so you start with the area that will provide the greatest return on asset. The OEE formula will show how improvements in changeovers, quality, machine reliability improvements, working through breaks, and more will affect your bottom line.
This simple formula will be an excellent benchmarking tool as you strive towards world-class productivity in your facility. The derived OEE percentage is easy to understand, and displaying this single number where all facility personnel can view it makes for a great motivational technique. By giving your employees an easy way to see how they are doing in overall equipment utilization, production speed, and quality, they will strive for a higher number!
I highly recommend using an automated equipment monitoring system with an LCD display for your OEE in each respective area of your facility so all can monitor. To the employee in each area, it will become as common to glance at as the speedometer on a car. While showing machine speed with such a display helps, machine speed is only a small percentage of your overall equipment effectiveness - OEE.
How to use OEE?
Implementing the Overall Equipment Effectiveness formula in your facility can take many forms. OEE is an analysis and benchmarking tool for either reliability, equipment utilization, or both. Make sure to let indecision on how to use OEE best become a barrier preventing you from using it. Start small, if necessary, by picking your bottleneck to collect the OEE metrics. Once you see firsthand what a valuable tool it is, you can gradually take OEE measurements on other equipment in your facility. If you work in manufacturing, there is no substitute for going out to the shop floor and taking rough OEE measurements. You will be surprised by what you find!
While monitoring OEE per equipment brings focus to the equipment itself, it may only provide the true cause of major costs if the cause is apparent. For example, OEE can appear improved by purchasing oversized equipment, providing redundant supporting systems, and increasing the frequency of overhauls.
You will need to use other tools and methodologies available to you to improve your OEE percentage, like TDC, RCA, FTA, etc. TDC is a relatively new methodology focusing on True Downtime Cost™ for justification and better management decisions. You can learn more about TDC at What is TDC. TDC overcomes the main implementation barrier for OEE by giving maintenance managers a tool to show actual cost savings in a relationship with OEE.
For the ultimate decision-making tool, incorporate OEE with TDC.
Front End: Incorporate TDC into your data collection.
Back End: Incorporate TDC into your software reporting by requiring it of your software vendor.
On a larger scale, you should not only be calculating equipment OEE, but you should also be calculating a production line OEE and, within a corporation, a facility OEE. Factory automation companies are incorporating OEE into the reports they generate automatically! A few companies also specialize in providing shop floor data in automatic, easy-to-read OEE reports. If you would like more information or recommendations on companies that can get your automated OEE system up and running, please contact us using the button on the left, and we'll be happy to recommend a service provider.
About the Author: Don Fitchett is President of Business Industrial Network and author of several manufacturing cost analysis articles published in industry-related journals and websites. Please feel free to copy and pass along this article as long as all credits are included.
Note: "True Downtime Cost"™ is a registered trademark of Business Industrial Network